Measuring the Environmental Footprint of AI Applications
AI engineers increasingly call APIs rather than train models, making environmental impact harder to track. Here's how to measure it systematically.

Some years ago, when I first joined the world of AI, I was deeply interested in measuring the environmental impact of the projects I was developing. I was a regular user of CodeCarbon, an open-source library that can be embedded into your code to measure the energy consumption and carbon emissions of machine learning training. You start a tracker, run your training loop, stop the tracker, and get the kWh and CO2e emissions of your experiment. Measuring not only the performance but also the emissions of models felt like a concrete step toward making a difference.
Two weeks ago, while discussing some aspects of this tool with a colleague, I realized I could not answer several of their questions. And somehow, as agents and generative AI have become a growing part of our daily work, their environmental footprint has been left behind — not because of a lack of tools, but because the role of AI/ML engineers has evolved considerably.
That motivated me to reflect on the possibilities we have for bringing this good practice back into our workflows, so that the projects we work on in 2027 take this dimension into account.
If you started working in data science a few years ago, you probably remember a time when we built and ran our own models. We chose the data, trained the models, and deployed them on hardware we could see and understand. In 2026, many of us have become users of AI systems rather than builders of the models themselves. We call an API, chain prompts, connect an agent to tools, or switch on an AI feature built by someone else. The computation happens on machines we never see, in data centres we cannot name, running models whose size is often a secret.
In this article, I want to explore how we can step back from our projects, break them down into smaller components, and find ways to evaluate their environmental impact — not perfectly, but well enough to establish where we can make a difference.
To make this concrete, I’ll follow one common use case throughout: a RAG assistant built on a hosted model.
1. What do we mean by environmental impact?
When discussing the footprint of AI, the conversation typically centres on carbon. However, carbon is only one of five major impacts:
- Energy: the electricity consumed by machines, expressed in watt-hours (Wh) or kilowatt-hours (kWh).
- Greenhouse gas emissions: expressed in grams or kilograms of CO2 equivalent (CO2e). These depend on how electricity is produced: for a given amount of energy, emissions are significantly higher if the electricity comes from coal rather than from nuclear or wind power.
- Water: used for cooling data centres (via evaporation) as well as for electricity generation.
- Materials: metals and minerals extracted for the manufacturing of chips, servers, and network equipment.
- Electronic waste: the fate of IT hardware once it is replaced.
These impacts occur at various stages of a machine’s life cycle — from manufacturing, through its period of use, to end-of-life. A comprehensive analysis of these stages and impacts is known as a life cycle assessment (LCA).
This article focuses exclusively on the usage phase — that is, the electricity consumed by machines while running AI, along with the resulting carbon emissions and water consumption. Hardware manufacturing and end-of-life disposal are not covered here, not because they are unimportant, but because they are particularly complex to evaluate. The usage phase is also the stage over which ML and AI engineers can exert the most influence.
2. Why is it hard to know where you stand as an AI engineer?
Our position within the AI value chain has evolved. Based on my observations of the job market, the various roles ML engineers occupy can be classified into five categories, arranged from those where we exert the most control to those where we exert the least.
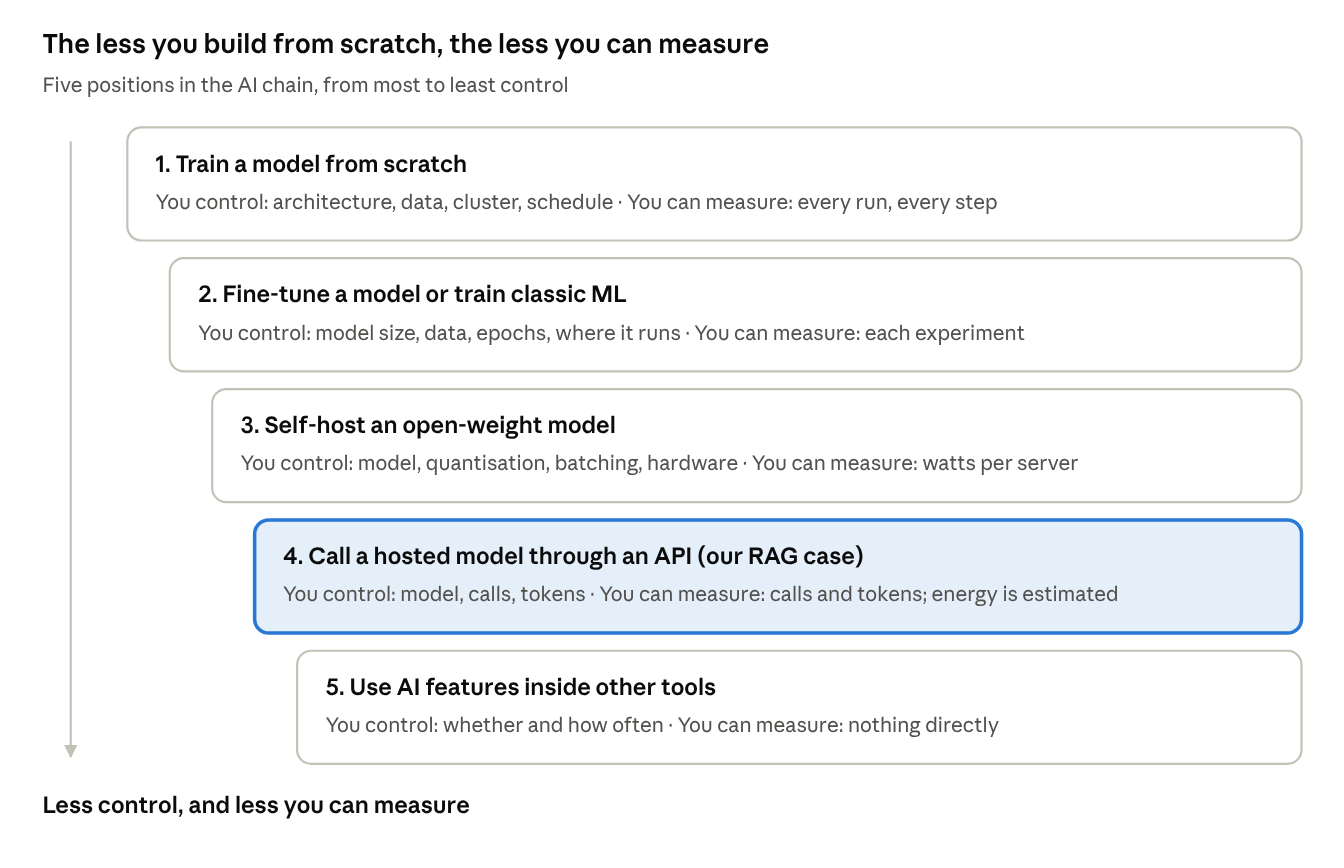
The logic is straightforward: the less you build from scratch, the harder it becomes to measure the environmental impact of your actions. In position 1, you own every machine and can track every watt consumed. In position 4, the most critical computations take place on a third party’s servers — those of your LLM provider. Your footprint has not vanished; it has simply shifted to a place you can no longer see.
3. How a provider computes its numbers: Google case study
In August 2025, Google published its method and results for a single text prompt sent to Gemini. According to Google, the median Gemini text prompt uses 0.24 watt-hours (Wh) of energy, emits 0.03 g of CO2 equivalent, and uses 0.26 mL of water. By median, they mean half of the prompts use less and half use more. Understanding how that number was computed is worthwhile before thinking about our own impact.
Is 0.24 Wh a lot?
A watt-hour is the energy a device drawing 1 watt uses in one hour. Your electricity bill counts in kilowatt-hours: 1 kWh = 1,000 Wh.
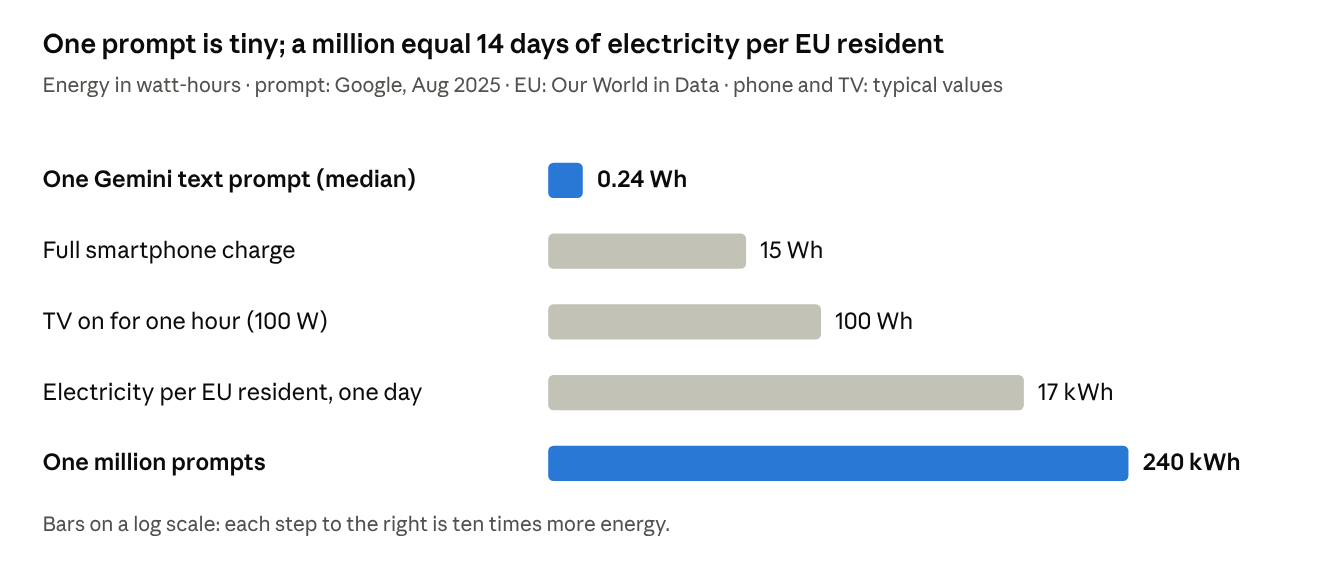
One prompt represents less than 2% of a phone charge. But a project is never one prompt. A million prompts at 0.24 Wh is 240 kWh — about 14 days of electricity used per person in the EU, based on the Our World in Data report. An assistant answering 30,000 questions a day reaches a million prompts in about a month.
How was that number computed?
To arrive at 0.24 Wh, Google accounts for four components. These are worth understanding because every per-prompt figure you will ever read includes some of them, or leaves some out.
1. The AI chips computing your answer. Once you send a prompt, it is directed to a server in a Google data centre equipped with AI chips (TPUs for Google; GPUs otherwise). The chips process the model’s mathematics — reading your prompt and generating the answer word by word. This component covers the power consumed by those chips while processing your request.
2. The rest of the server, and servers standing by. AI chips are not the only components in a server. Each server also has a CPU and RAM that accept requests, preprocess data, and deliver responses — these also consume power. Google also maintains idle servers on standby for traffic spikes or hardware failures, much like taxis queuing at a rank. These servers do nothing but consume power, and Google distributes their energy cost across all prompts.
3. The data centre building itself. Surrounding the servers, the building requires cooling, power transformation, and distribution. This overhead is quantified using PUE (power usage effectiveness): the total energy of the data centre divided by the energy of the servers. Google’s data centres operate with a PUE of 1.09 on average, meaning every 1 Wh used by the servers costs an additional 0.09 Wh for the building.
4. From energy to carbon and water. Steps 1 to 3 add up to the energy of one prompt: 0.24 Wh. Step 4 converts that into carbon by multiplying the energy by the carbon intensity of the electricity — how many grams of CO2 were emitted to produce each kWh. This is where geography matters. The same 0.24 Wh emits far less in a country whose electricity comes mostly from hydro, nuclear, or wind than in one running on coal or gas. Using Google’s own electricity mix, the result is 0.03 g of CO2e. Water is computed the same way, using a litres-per-kWh factor for cooling.
According to DatacenterDynamics, the boundary excludes the network, the user’s device, model training, and data storage. Google also notes that the figures were not verified by an independent third party.
4. From Google’s number to our projects
Google’s 0.24 Wh describes a median chat question sent to Gemini. In your own projects, your model, your prompts, and your provider’s data centres will differ, so you cannot reuse that number directly. What you can reuse is the method — and you do not have to apply it by hand. Two free tools do it for you:
- EcoLogits, for the models you call. It applies the steps above to the provider’s servers and gives you an energy figure per API call, for your specific model.
- CodeCarbon, for the machines you run. It applies the same steps to your own servers, including time spent idle.
Three terms you will encounter in their settings and outputs:
- Idle: the machine is switched on but performing no useful work.
- PUE: the overhead factor from step 3. Ask your cloud provider for their figure; Google’s is 1.09, and most data centres are higher. In CodeCarbon, it is set as a parameter.
- Carbon intensity (or grid factor): grams of CO2e emitted per kWh of electricity consumed where the machine runs. It varies several-fold from one country to another, and both tools look it up automatically.
5. The full picture: what you count, what the provider counts, what nobody counts
Here is how the pieces fit together for one call of an AI application, such as the RAG assistant covered in the next section.
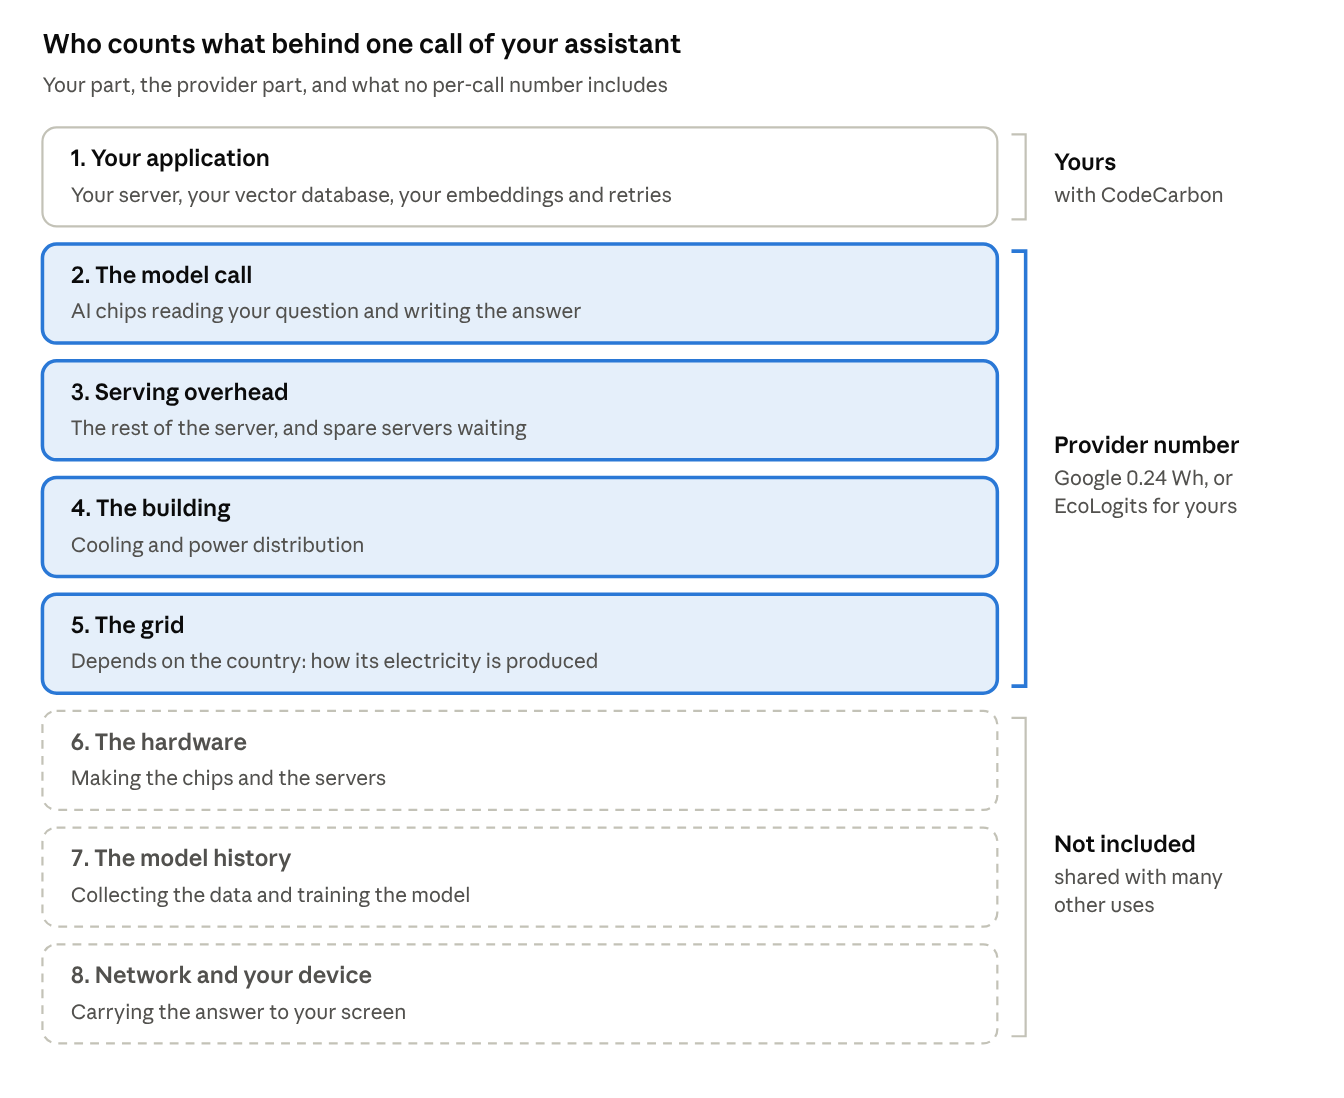
Layer 1 is yours to measure, with CodeCarbon. This covers your API server, your retrieval infrastructure, and any preprocessing your application performs before and after the model call. These are machines you operate, so their energy consumption is directly observable.
Layer 2 is the provider’s to report, via tools like EcoLogits. The LLM inference itself happens on hardware you do not control. EcoLogits uses published model and hardware specifications to estimate the energy cost of each API call and surfaces that estimate directly in your code.
Layer 3 is what neither side currently accounts for. Network transmission between your servers and the provider, the energy cost of the user’s device, and the embodied carbon in the hardware manufacturing chain all fall outside what either tool measures today. Acknowledging this gap is part of an honest assessment.
Together, these layers give a structured way to reason about the footprint of a modern AI application — even when much of the computation is invisible. The goal is not a perfect number, but a principled estimate that can guide decisions about model choice, infrastructure location, prompt design, and usage patterns.